Understand the 12 axes
Strong Traditionalist: Morality
12.6–27.5% Progressive · 72.5–87.4% Traditionalist
What this band means
Strong Traditionalist covers 12.6–27.5% Progressive. Your answers favor Traditionalist, with a strong preference in this part of the questionnaire. Progressive positions welcome social change, revised norms and wider personal choices. Traditionalist positions give more authority to inherited customs, established moral frameworks and continuity. These labels describe a broad tension rather than a complete moral philosophy. The result is independent of religious affiliation and economic policy. A progressive moral profile need not share the same economy or governance preferences as another progressive profile. This band describes the direction and distance of your score from the center, rather than the percentage of people who agree with you. Two people in the same band can still disagree on particular policies. Their remaining eleven axes may also differ substantially. Use the sample statements to identify the trade-offs that produced this part of your result. The catalog examples below offer points of comparison within the model; they are not a survey of quiz participants.
Across the reference catalog
These 182 profiles are reference models, not responses from quiz participants. The distributions describe this catalog’s composition.
Among 55 ideologies, the median Morality score is 20% Progressive. The lowest value is 13.8% (Alt-Lite), while the highest is 27.5% (Eco-Conservatism). These values describe the reference set on this particular axis.
Among 47 countries and regions, the median Morality score is 22.5% Progressive. The lowest value is 13.4% (Utah (United States)), while the highest is 27.5% (Palestine). These values describe the reference set on this particular axis.
Among 80 figures, the median Morality score is 21.2% Progressive. The lowest value is 13.7% (Constantine the Great), while the highest is 27.5% (Martin Heidegger). These values describe the reference set on this particular axis.
Examples in this band

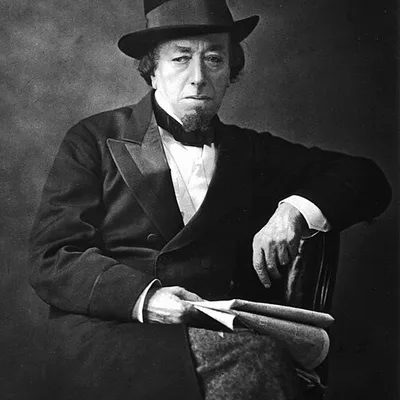
How the other axes combine
These are medians for reference profiles in this band. They do not predict the other views of a person with this result.
Among the 182 profiles in Strong Traditionalist, Structure has a median of 26.65% Federal and 73.3% Unitary.
Among the 182 profiles in Strong Traditionalist, Representation has a median of 32.5% Democracy and 67.5% Autocracy.
Among the 182 profiles in Strong Traditionalist, Power has a median of 72.9% Security and 27.1% Liberty.
Among the 182 profiles in Strong Traditionalist, Immigration has a median of 68.8% Assimilation and 31.2% Multiculturalism.
Among the 182 profiles in Strong Traditionalist, Diplomacy has a median of 65.1% Militarist and 34.9% Pacifist.
Among the 182 profiles in Strong Traditionalist, Intervention has a median of 36.2% Non-interventionist and 63.8% Nationalist.
Among the 182 profiles in Strong Traditionalist, Economy has a median of 49.7% Public and 50.3% Private.
Among the 182 profiles in Strong Traditionalist, Control has a median of 63.7% Planning and 36.3% Free market.
Among the 182 profiles in Strong Traditionalist, Trade has a median of 67.5% Protectionism and 32.5% Globalism.
Among the 182 profiles in Strong Traditionalist, Religion has a median of 25% Irreligious and 75% Religious.
Among the 182 profiles in Strong Traditionalist, Technology has a median of 57.5% Technology and 42.5% Biology.
Consider the questions
01Same-sex couples should have the same right to adopt children as other couples.
02The gender identity declared by each person must be respected.
03The traditional family should serve as a model for society.
Explore the seven bands
Your perspective, in detail
Where do your ideas stand?
Explore twelve dimensions and discover the combinations that make your perspective your own.