Understand the 12 axes
Strong Technology: Technology
72.5–87.4% Technology · 12.599999999999994–27.5% Biology
What this band means
Strong Technology covers 72.5–87.4% Technology. Your answers favor Technology, with a strong preference in this part of the questionnaire. Technology positions welcome scientific development, technological acceleration and the possibility of changing human capacities. Biology positions place greater value on natural limits, biological continuity and caution about far-reaching technical intervention. The Biology pole does not imply ignorance of science, and the Technology pole does not establish technical expertise. The score describes priorities when innovation and preservation pull in different directions. This band describes the direction and distance of your score from the center, rather than the percentage of people who agree with you. Two people in the same band can still disagree on particular policies. Their remaining eleven axes may also differ substantially. Use the sample statements to identify the trade-offs that produced this part of your result. The catalog examples below offer points of comparison within the model; they are not a survey of quiz participants.
Across the reference catalog
These 132 profiles are reference models, not responses from quiz participants. The distributions describe this catalog’s composition.
Among 51 ideologies, the median Technology score is 77.5% Technology. The lowest value is 72.5% (Trotskyist Communism), while the highest is 85.6% (Stalinist Socialism). These values describe the reference set on this particular axis.
Among 15 countries and regions, the median Technology score is 73.8% Technology. The lowest value is 72.5% (Saudi Arabia), while the highest is 83.2% (Shenzhen (China)). These values describe the reference set on this particular axis.
Among 66 figures, the median Technology score is 76.2% Technology. The lowest value is 72.5% (Richard Spencer), while the highest is 86.8% (Curtis Yarvin). These values describe the reference set on this particular axis.
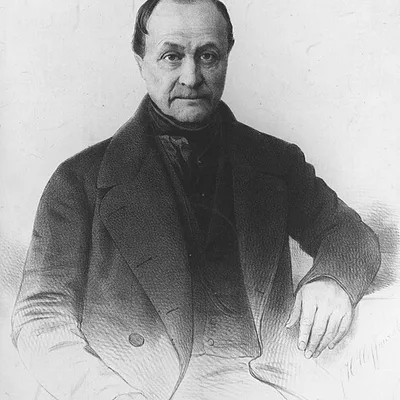
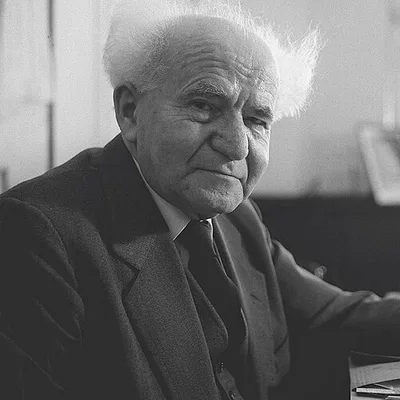
Examples in this band



How the other axes combine
These are medians for reference profiles in this band. They do not predict the other views of a person with this result.
Among the 132 profiles in Strong Technology, Structure has a median of 27.5% Federal and 72.5% Unitary.
Among the 132 profiles in Strong Technology, Representation has a median of 33.15% Democracy and 66.8% Autocracy.
Among the 132 profiles in Strong Technology, Power has a median of 68.1% Security and 31.9% Liberty.
Among the 132 profiles in Strong Technology, Immigration has a median of 55% Assimilation and 45% Multiculturalism.
Among the 132 profiles in Strong Technology, Diplomacy has a median of 62.05% Militarist and 38% Pacifist.
Among the 132 profiles in Strong Technology, Intervention has a median of 40% Non-interventionist and 60% Nationalist.
Among the 132 profiles in Strong Technology, Economy has a median of 48.599999999999994% Public and 51.4% Private.
Among the 132 profiles in Strong Technology, Control has a median of 62.5% Planning and 37.5% Free market.
Among the 132 profiles in Strong Technology, Trade has a median of 48.599999999999994% Protectionism and 51.4% Globalism.
Among the 132 profiles in Strong Technology, Religion has a median of 70.6% Irreligious and 29.4% Religious.
Among the 132 profiles in Strong Technology, Morality has a median of 44.4% Progressive and 55.6% Traditionalist.
Consider the questions
01Society should prioritize technological innovation and industrialization.
02We should expand the use of AI and automation, even if it eliminates many professions.
03I prefer a simple, natural way of life to a life full of technology.
Explore the seven bands
Your perspective, in detail
Where do your ideas stand?
Explore twelve dimensions and discover the combinations that make your perspective your own.